
Physics homework question about waves.
Asked by
Mariah (
25883
)
January 20th, 2015
I don’t want to give all the details for the problem out of academic honesty concerns, but some guidance would be nice.
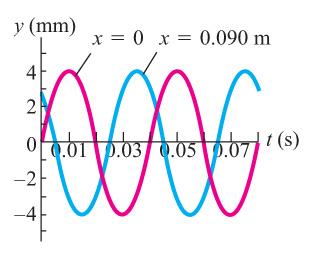
I have the following graph. The blue and pink waves show the relationship between time and y displacement for two different points along the x axis of the wave.
I need to estimate the wavelength of this wave. Note that it cannot just be directly estimated from the graph because the x axis is time, not x displacement.
I fixed t at various values and drew a number of y versus x graphs, but there are multiple interpretations for how the wave looks as it passes between the two points, as shown in this sketch of mine: http://i.imgur.com/GvzQdPy.jpg
I don’t believe I know any formulas that would relate wavelength to any of the information that I already know (amplitude and period/frequency).
A hint, please?
Observing members:
0 Composing members:
0
Composing members:
0
11 Answers

“Frequency times wavelength equals speed.” So frequency divided by speed equals wavelength.
(Don’t know if this helps but I thought I’d take a crack at it. Info here is from “The Wonders of Physics: An introduction to the physical world.” A deluxe Golden Book, text by Irving Adler, copyright 1966 by Western Publishing Company, New York.)

Use @kritiper ‘s info. Then assume speed = speed of light, since this could be an electromagnetic wave. You should be able to calculate your answer.
I don’t know the velocity. It cannot be assumed to be an electromagnetic wave.
You are right. Look at the graph. At t=0.01s, x=0m At t=0.035s, x=0.090m Now you can calculate m/s.
No, unfortunately. The graph is really ambiguous, I apologize. The entire pink curve is the y position of the point x=0 for various times. The entire blue curve is the y position of the point x=.09 for various times. Unless I misunderstand you.
Thanks for trying to help me solve it, by the way, guys.

I agree there is not enough info, but practically, that sure looks like an audio speaker.
You know the diaphragm is moving +/- 4 mm. And you know the frequency, since the period is 0.04 sec 1/0.04 = 25 Hz. It looks like it is working in air but it might also be in helium or another gas.
I’m a lot closer to a solution now.
I have the formula y = amplitude*cos(2*pi*x/wavelength – 2*pi*t/period). I know the amplitude and period. So I can substitute in any (x,y,t) point from the graph and supposedly solve for the wavelength.
I have done this, but I’m confused. Shouldn’t I get the same wavelength for any point along the wave that I substitute in? But I’m getting lots of different answers for various points.

It’s been decades since I was a physics major, but maybe this link will help:
Traveling Sine Wave
y = A sin ( kx – wt + p) where w=omega (angular frequency) and p = phi (phase offset)
Looks like you’re already on to this kind of solution.
Thanks. Do you have any clue why plugging in different points along the wave would lead to a different value k????
I don’t know—the given info is presented in a weird way. It looks from the diagram that period T is 0.04 seconds, amplitude A=4, and an x-offset of .09 m translates to a time offset of around .023 sec, but I’m afraid I can’t help much coming up with the desired function y(x,t).
Answer this question 
This question is in the General Section. Responses must be helpful and on-topic.


