
Send to a Friend
Physics homework question about waves.
I don’t want to give all the details for the problem out of academic honesty concerns, but some guidance would be nice.
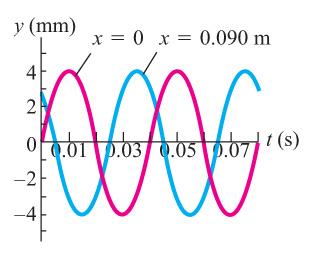
I have the following graph. The blue and pink waves show the relationship between time and y displacement for two different points along the x axis of the wave.
I need to estimate the wavelength of this wave. Note that it cannot just be directly estimated from the graph because the x axis is time, not x displacement.
I fixed t at various values and drew a number of y versus x graphs, but there are multiple interpretations for how the wave looks as it passes between the two points, as shown in this sketch of mine: http://i.imgur.com/GvzQdPy.jpg
I don’t believe I know any formulas that would relate wavelength to any of the information that I already know (amplitude and period/frequency).
A hint, please?
Using Fluther
or
